Older Americans Act
Services Funded
Payments for services provided between January 1–December 31, 2022.
Nutrition
81,124 meals provided in group settings and 872,509 delivered to individuals in their homes.
| Older Americans Act | $6,260,410 |
| COVID Emergency Funds | $2,425,192 |
| Total | $8,685,602 |
Nutrition Education
155 hours of nutrition education.
| Older Americans Act | $1,030 |
| COVID Emergency Funds | $21,523 |
| Total | $22,553 |
Special Access
11,748 hours of services to individuals and 739 group events to overcome cultural/language barriers in making community and government services accessible.
| Older Americans Act | $311,871 |
| COVID Emergency Funds | $383,345 |
| Total | $695,216 |
Caregiver Services
25,523 units of counseling, support group, and other assistance for caregivers of older adults.
| Older Americans Act | $929,055 |
| COVID Emergency Funds | $256,318 |
| Total | $1,185,373 |
Assisted Transportation
28,465 rides for individuals who have difficulties (physical or cognitive) using other forms of transportation.
| Older Americans Act | $510,089 |
| COVID Emergency Funds | $186,329 |
| Total | $696,418 |
Chore and Homemaker Services/Home Modifications
21,393 hours of chore and homemaker services, including 191 home modification projects that help older adults continue to live in their own homes.
| Older Americans Act | $442,960 |
| COVID Emergency Funds | $384,192 |
| Total | $827,152 |
Telephone Reassurance
6,836 calls with isolated older persons to provide social contact and ensure continued well-being.
| Older Americans Act | $64,224 |
| COVID Emergency Funds | $40,614 |
| Total | $104,838 |
Consultation, Technology and Visiting Services
982 hours of consultation and visiting services. 148 technology projects.
| Older Americans Act | $1,030 |
| COVID Emergency Funds | $110,053 |
| Total | $111,083 |
Legal Assistance/Education
8,922 hours of legal assistance.
| Older Americans Act | $296,844 |
| COVID Emergency Funds | $0 |
| Total | $296,844 |
Health Promotion
135 classes served 1,044 people in taking steps to stay healthy, manage chronic conditions and prevent falls.
| Older Americans Act | $237,710 |
| COVID Emergency Funds | $88,731 |
| Total | $326,441 |
Community-based Partner Organizations
The following organizations received Older Americans Act funding through Trellis in 2022:
Anoka County Community Action Program
Anoka County – Family Caregiver Connection
Bhutanese Community Organization of MN
Community Action Partnership of Scott, Carver & Dakota Counties
Jewish Family & Children’s Service of Minneapolis
Jewish Family Service of St. Paul
Lao Advancement Organization of America
Living At Home Network/Block Nurse Program
Longfellow Seward Healthy Seniors
Minneapolis American Indian Center
Normandale Center for Healing and Wholeness
Northeast Youth & Family Services
Pillsbury United Communities – Brian Coyle Community Center
Presbyterian Homes – Optage Senior Dining
SEWA – Asian Indian Family Wellness
Southern MN Regional Legal Services
Touchstone Mental Health Services
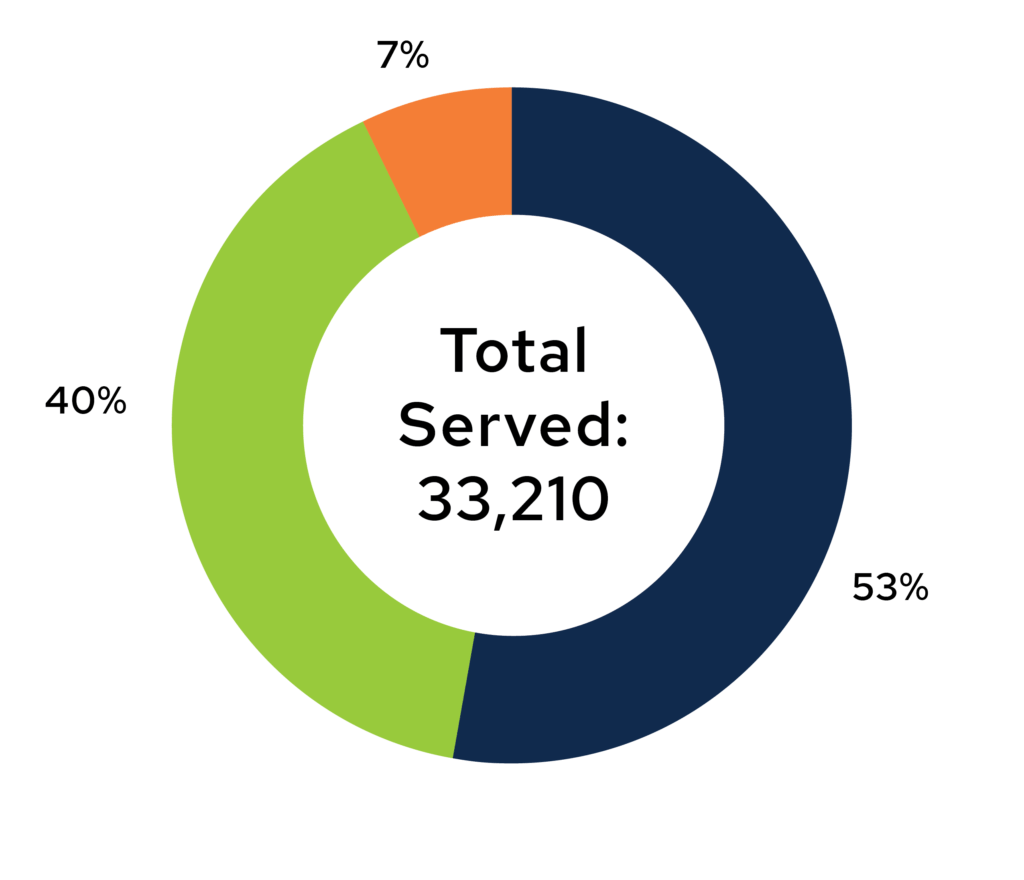
People Served by Race

Total Served 33,210
White: 53%
BIPOC: 40%
Unknown: 7%
Public Information Services (PIS) has been removed from the demographic data of those served through more traditional services. Since PIS is designed to support caregivers in large group settings (resource fairs, etc.), individual demographic data cannot be collected.

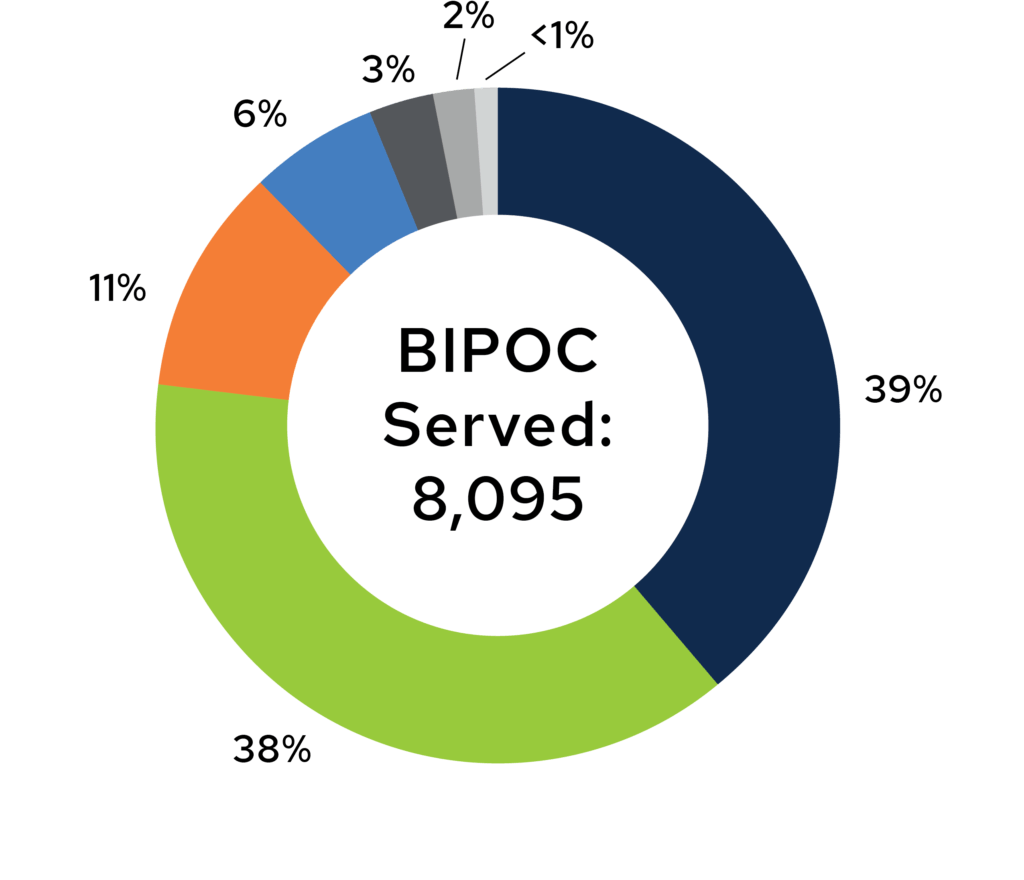
BIPOC Served 8,095
Asian: 39%
Black/African American: 38%
Hispanic/Latino: 11%
American Indian/Alaskan Native: 6%
Two or More Races: 3%
Other: <2%
Native Hawaiian: <1%
